4.1 Background on ggplot
To make graphs we will use a tidyverse package called ggplot. You don’t need to load ggplot separately if you load the tidyverse.
GGplot is very powerful and has many options. There are also different ways to build a ggplot, so the data and mapping noted below can be in different places. Below is how the PDS video explains how to structure the code.

The basic types of information include:
- your data: what dataset will you use
- the type of graph you will create: the
geom_type - and the variable(s) that you want to use: the
mappingandaesthetics
This second illustration labels the key parts of the code you will use. One other note, in ggplot, you use the + sign and not the pipe %>% to connect various parts of your code.
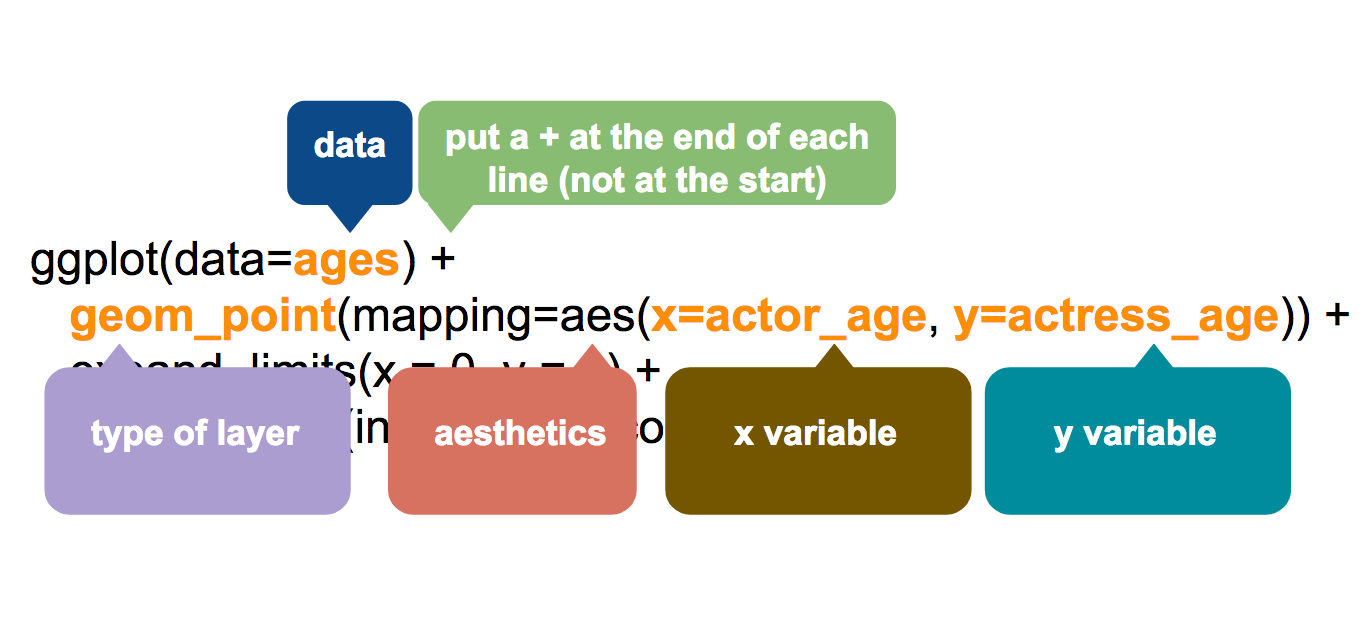
If this makes your eyes glaze over, that is okay for now. Let’s make some graphs!