8.2 Chi-Square
Chi-square uses categorical variables. For this example, we will use Example 1 from Chapter 7.2 that examines the relationship between education and perception of human rights in Ethiopia. You can look at the original example here.
We can now run our chi-square test. The general model looks like this (and remember you can copy this text):
by(dataset, dataset$3rdVariable, function(x)
   list(chisq.test(x$dependentVariable, x$independentVariable),
        chisq.test(x$dependentVariable, x$independentVariable)$observed,
        prop.table(chisq.test(x$dependentVariable, x$independentVariable)$observed,2)))
And for our example, we will run the chi-square test.
by(ethiopia_small, ethiopia_small$Q260, function(x)
  list(chisq.test(x$Q253, x$Q275R),
       chisq.test(x$Q253, x$Q275R)$observed,
       prop.table(chisq.test(x$Q253, x$Q275R)$observed,2)))
## ethiopia_small$Q260: Male
## [[1]]
##
## Pearson's Chi-squared test
##
## data: x$Q253 and x$Q275R
## X-squared = 11.054, df = 6, p-value = 0.08671
##
##
## [[2]]
## x$Q275R
## x$Q253 Lower Middle Higher
## A great deal of respect 63 10 17
## Fairly much respect 141 48 38
## Not much respect 108 38 34
## No respect at all 65 36 21
##
## [[3]]
## x$Q275R
## x$Q253 Lower Middle Higher
## A great deal of respect 0.16710875 0.07575758 0.15454545
## Fairly much respect 0.37400531 0.36363636 0.34545455
## Not much respect 0.28647215 0.28787879 0.30909091
## No respect at all 0.17241379 0.27272727 0.19090909
##
## ------------------------------------------------------------
## ethiopia_small$Q260: Female
## [[1]]
##
## Pearson's Chi-squared test
##
## data: x$Q253 and x$Q275R
## X-squared = 5.2522, df = 6, p-value = 0.5119
##
##
## [[2]]
## x$Q275R
## x$Q253 Lower Middle Higher
## A great deal of respect 61 9 8
## Fairly much respect 167 41 30
## Not much respect 125 42 22
## No respect at all 58 17 10
##
## [[3]]
## x$Q275R
## x$Q253 Lower Middle Higher
## A great deal of respect 0.14841849 0.08256881 0.11428571
## Fairly much respect 0.40632603 0.37614679 0.42857143
## Not much respect 0.30413625 0.38532110 0.31428571
## No respect at all 0.14111922 0.15596330 0.14285714In looking at the p-values we see that for males it is .087, for females the p-value is .512. Neither meets the required value of less than .05 to be statistically significant. We cannot reject the null hypothesis in either case. We would also want to interpret the tables as well.
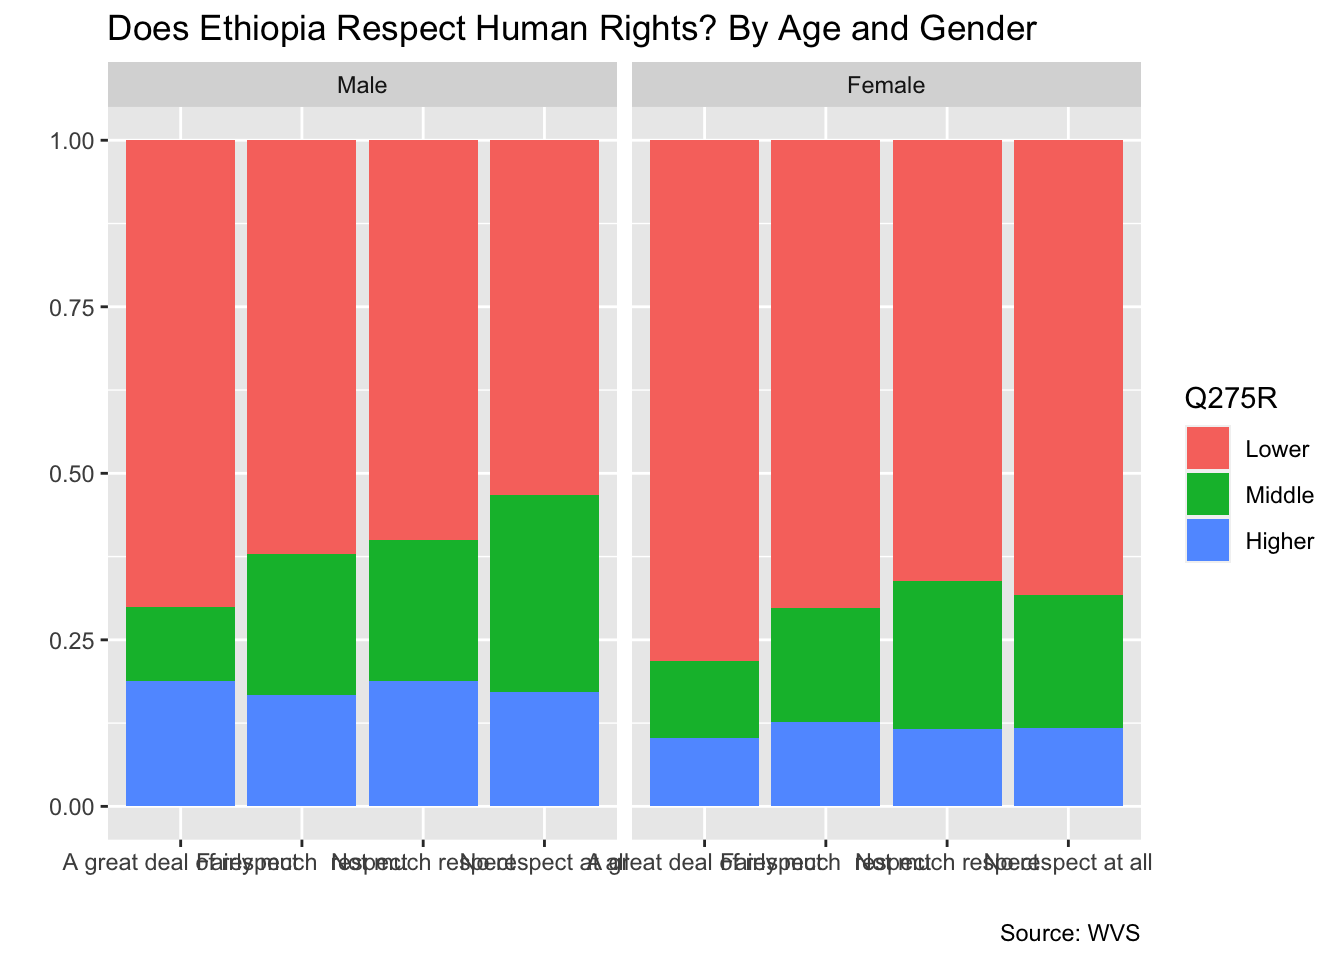
8.2.1 Representing this model in a faceted bar plot
To represent these three variables in a graph, we need to add one line to our two-variable graph, facet_wrap(), adding the third variable. Don’t forget the tilde ~. (Note: This variable needs additional work because the variable is age groups, but the model is appropriate for your work.)
ethiopia_small %>%
  filter(!is.na(Q253)) %>%
  filter(!is.na(Q275R)) %>%
  ggplot(aes(x = Q253,
             fill = Q275R)) +
  geom_bar(position = "fill") +
  ggtitle("Does Ethiopia Respect Human Rights? By Age and Gender") +
  labs(x = "", y = "", caption = "Source: WVS") +
facet_wrap(~ Q260)