4.2 The Bar Graph: a graph for categorical variables
There are categorical variables in all three datasets: WVS, States, and Gapminder. Bar graphs will come in handy. A brief discussion of the bar chart is at the bottom of this section of the OpenStax statistics text.
Here is a basic bar graph. The graph uses a recoded survey question from the Ethiopia dataset that asks how democratically the nation is governed.
## Frequencies
## ethiopia_small$Q251_recode
## Label: How democratically is this country being governed today
## Type: Factor
##
##                             Freq   % Valid   % Valid Cum.   % Total   % Total Cum.
## ------------------------- ------ --------- -------------- --------- --------------
##            Not Democratic    318     26.19          26.19     25.85          25.85
##       Somewhat Democratic    572     47.12          73.31     46.50          72.36
##                Democratic    324     26.69         100.00     26.34          98.70
##                      <NA>     16                               1.30         100.00
##                     Total   1230    100.00         100.00    100.00         100.00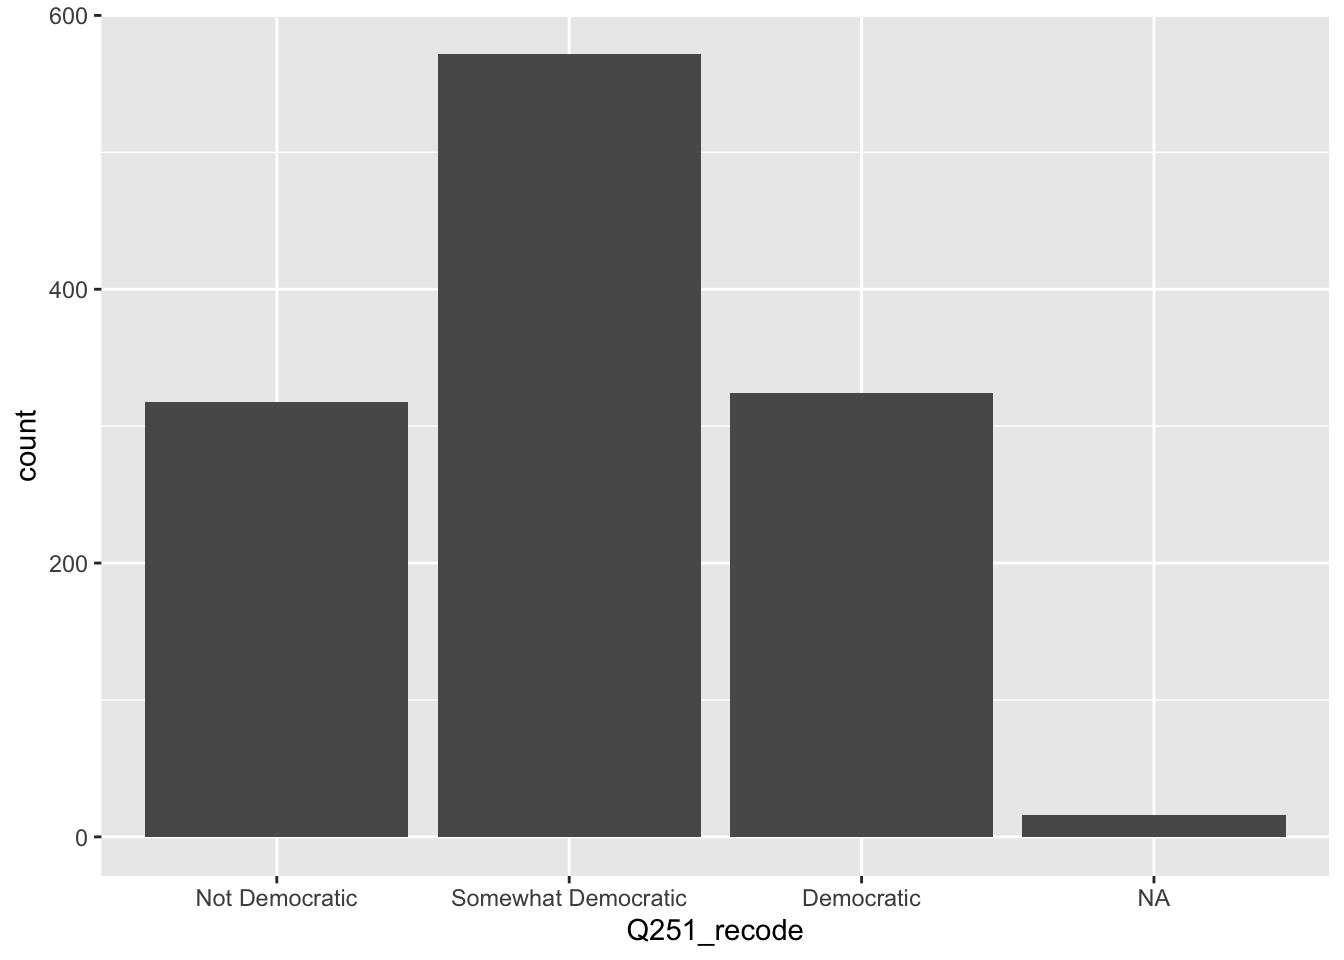
In this survey, Ethiopians are split on how democratic they see their government. The largest group sees the nation as “somewhat democratic.” And the rest are evenly split between seeing Ethiopia as “not democratic” and “democratic.”
Back to the graph, let’s add a few elements that will improve readability: a title (using ggtitle), a label on the y-axis, and we’ll clean up the variable name on the x-axis (using labs). This graph isn’t perfect, but it looks pretty good.
ethiopia_small %>%
  filter(!is.na(Q251_recode)) %>%
  ggplot() + geom_bar(mapping = aes(x = Q251_recode)) +
  ggtitle("How Democratically is Ethiopia Being Governed Today") +
  labs(x = "Recoded Q 251", y = "Respondents", caption = "Source: World Values Survey")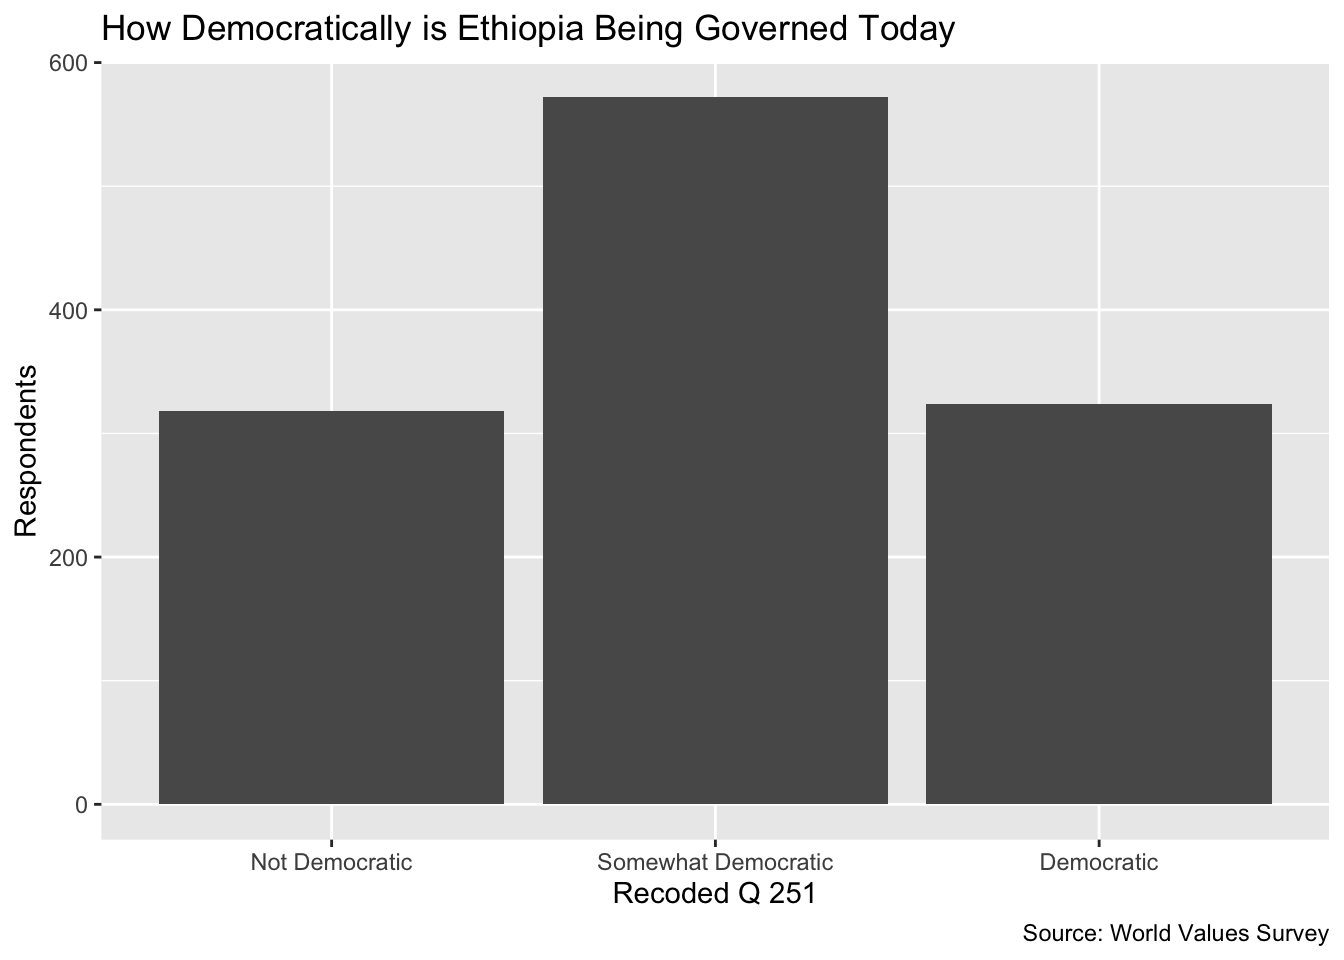
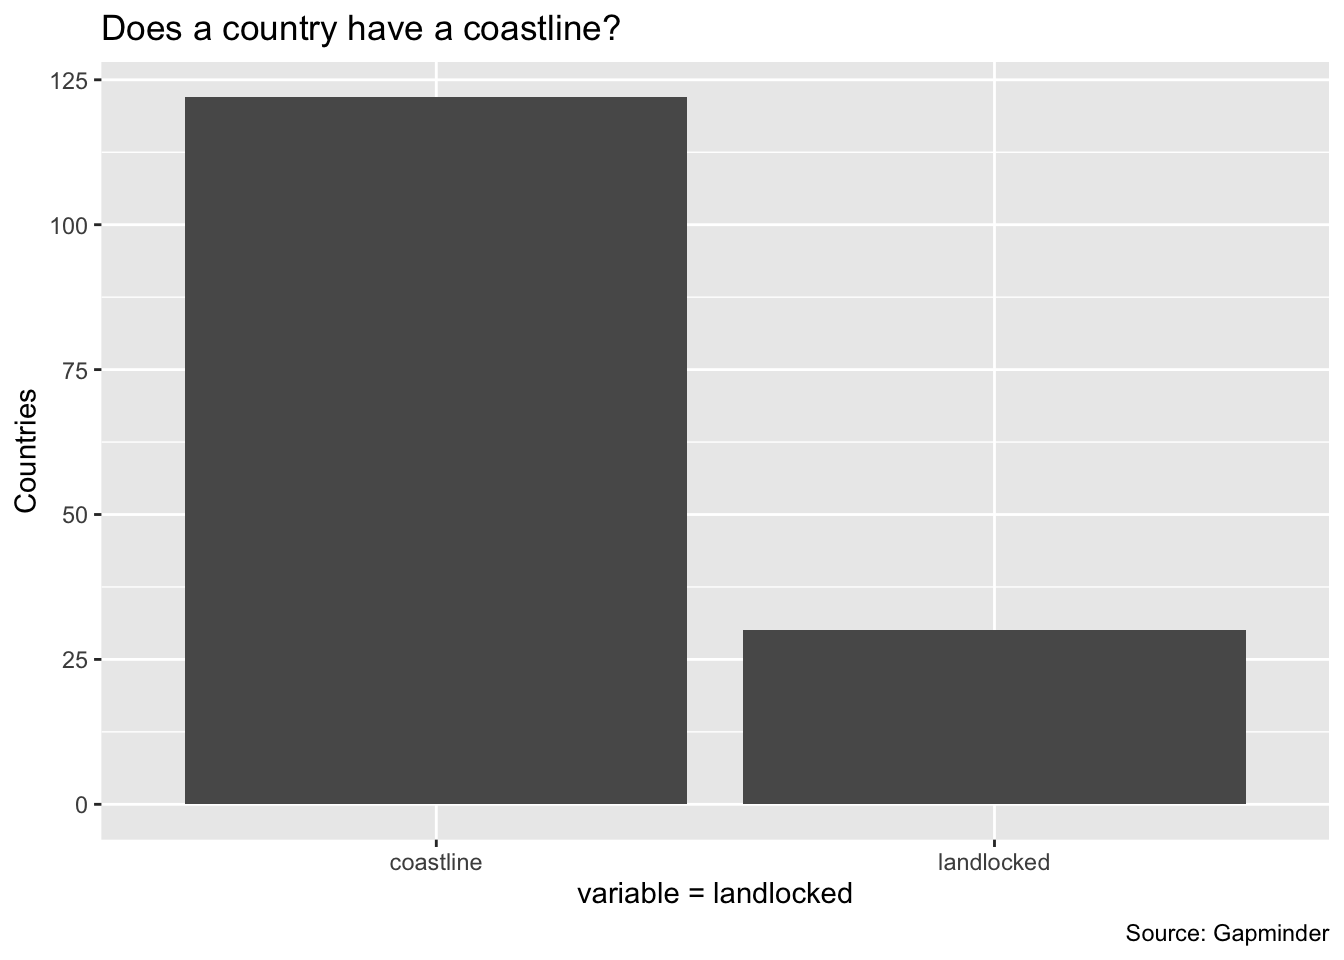
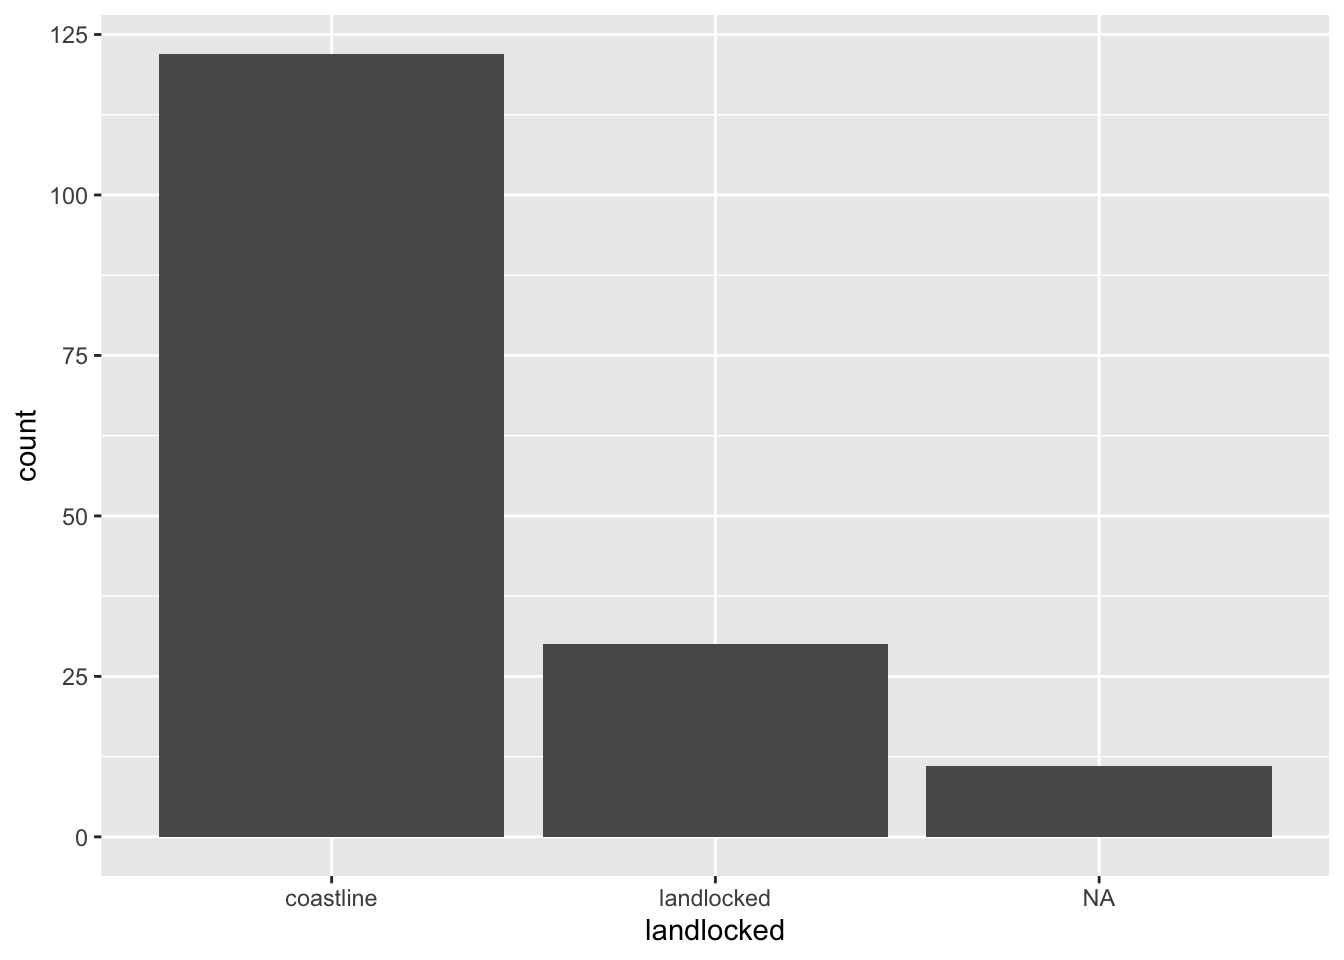
Our second example uses Gapminder. We are asking whether countries have a coastline or not. Note in the first graph there are NAs, countries with no data. We can eliminate them by using the filter command from dplyr. Note that this changes the structure of the ggplot because we have listed the data in the beginning. The third graph makes this plot more informative by adding titles and labels.
my_gapminder_data_2003 %>%
  filter(!is.na(landlocked)) %>%
  ggplot() + geom_bar(mapping = aes(x = landlocked))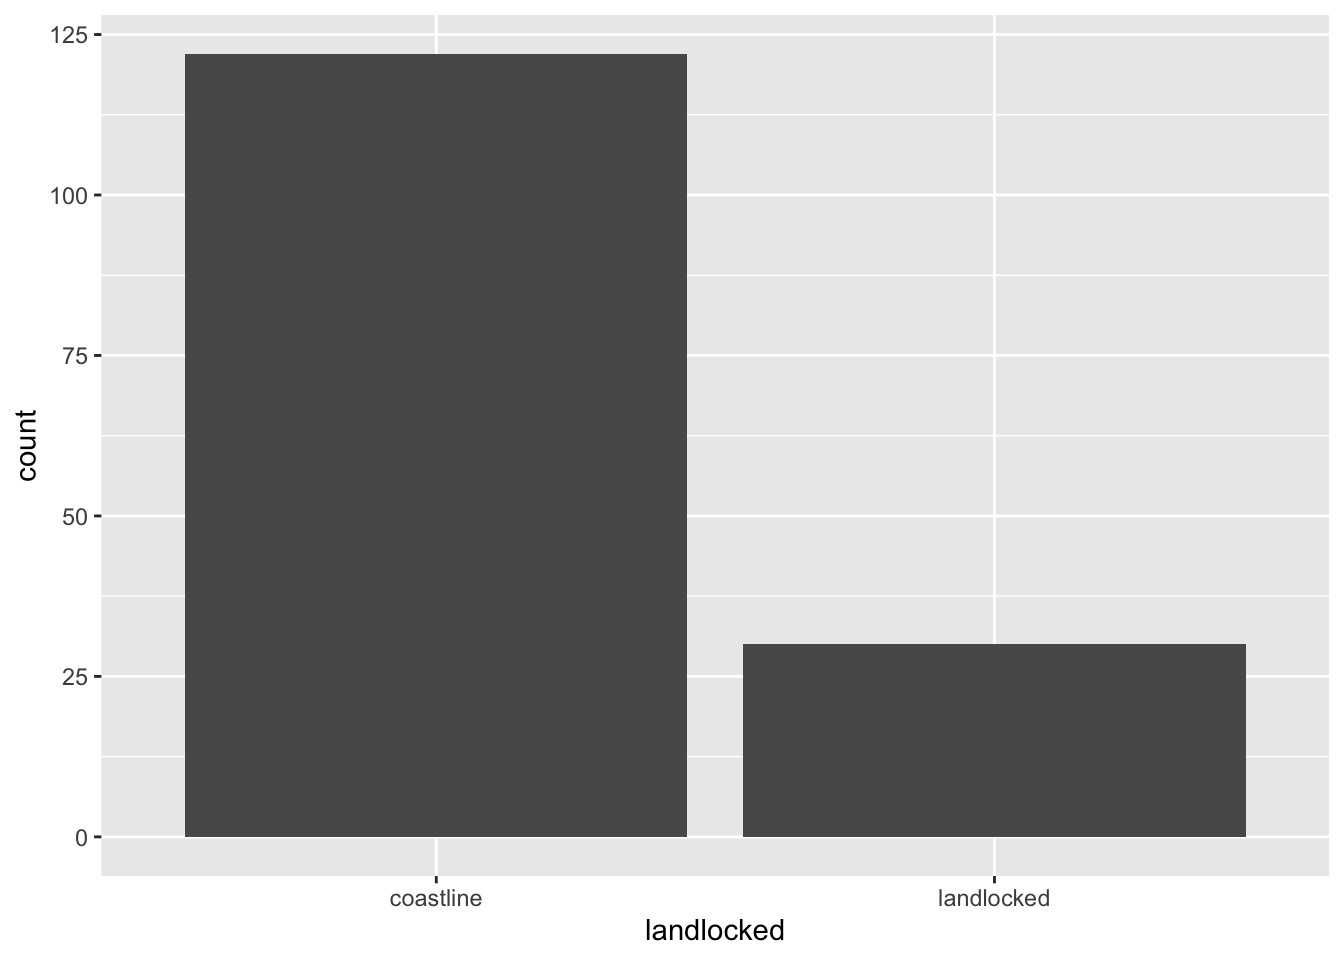
my_gapminder_data_2003 %>%
  filter(!is.na(landlocked)) %>%
  ggplot() + geom_bar(mapping = aes(x = landlocked))+
  ggtitle("Does a country have a coastline?") +
  labs(x = "variable = landlocked", y = "Countries", caption = "Source: Gapminder")