4.4 A simple box plot: a graph for quantitative variables
Box plots, sometimes known as box and whisker plots, are useful because they allow us to look at all three aspects of univariate statistics at once: center, spread, and shape. While they are usually used to compare sub-groups of a variable, they can be also used to look at the entire variable at once.
Watch a video explaining how to read a box plot. Here is a statistics text on the box plot.
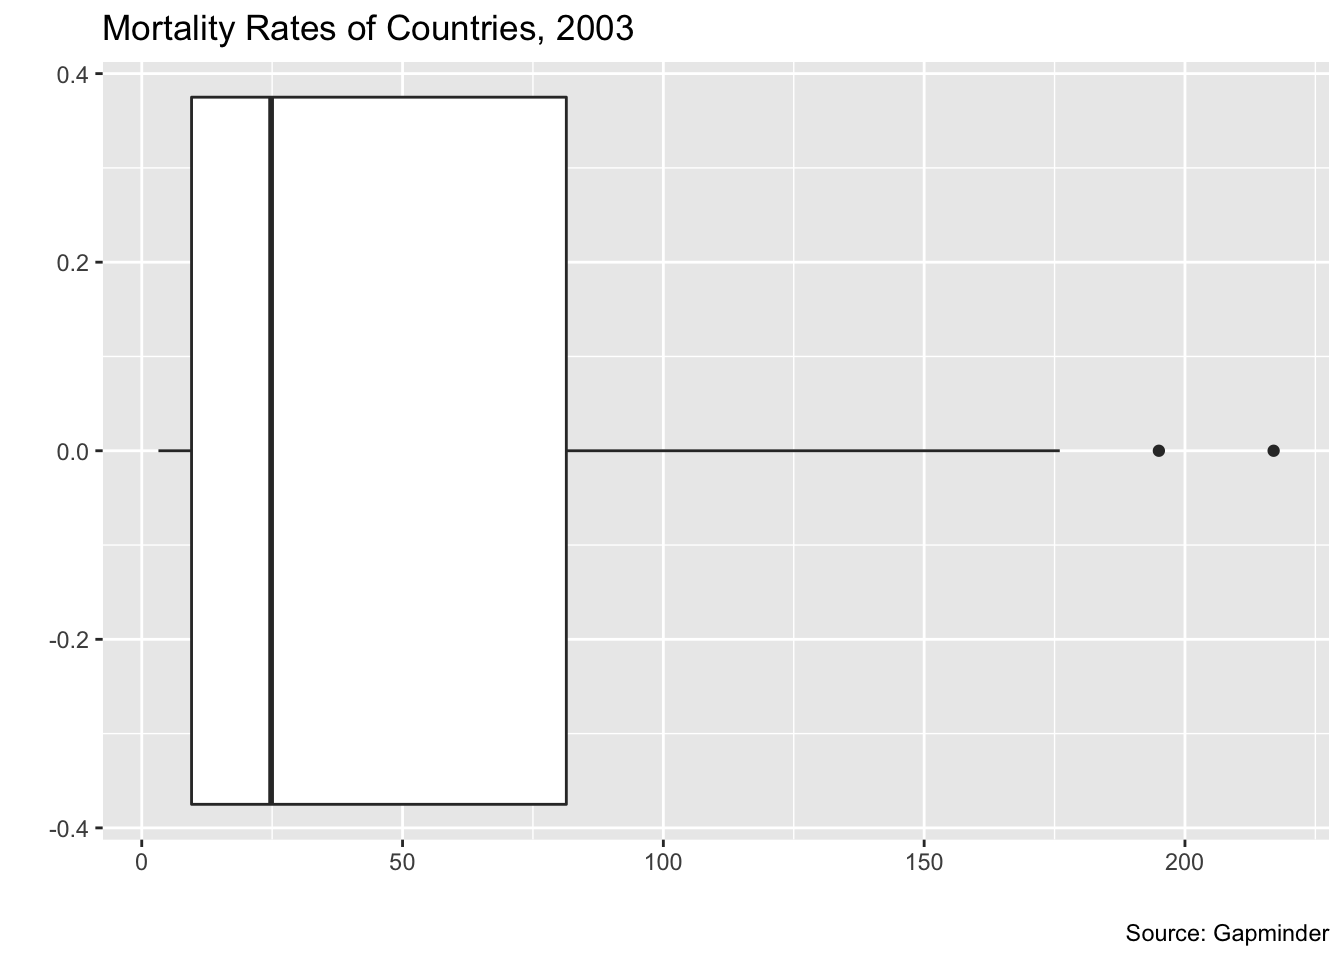
One difference from the explanations that you should note below is that in ggplot, data points that are outliers are noted with points.
Here are two examples from the States and Gapminder datasets.
ggplot(data = my_usstate_data_2011_small) + geom_boxplot(mapping = aes(x = pctfemaleleg)) +
  ggtitle("Percentage of Women in State Legislatures, 2011") +
  labs(x = "percent", y = "", caption = "Source: ICPPR State Data")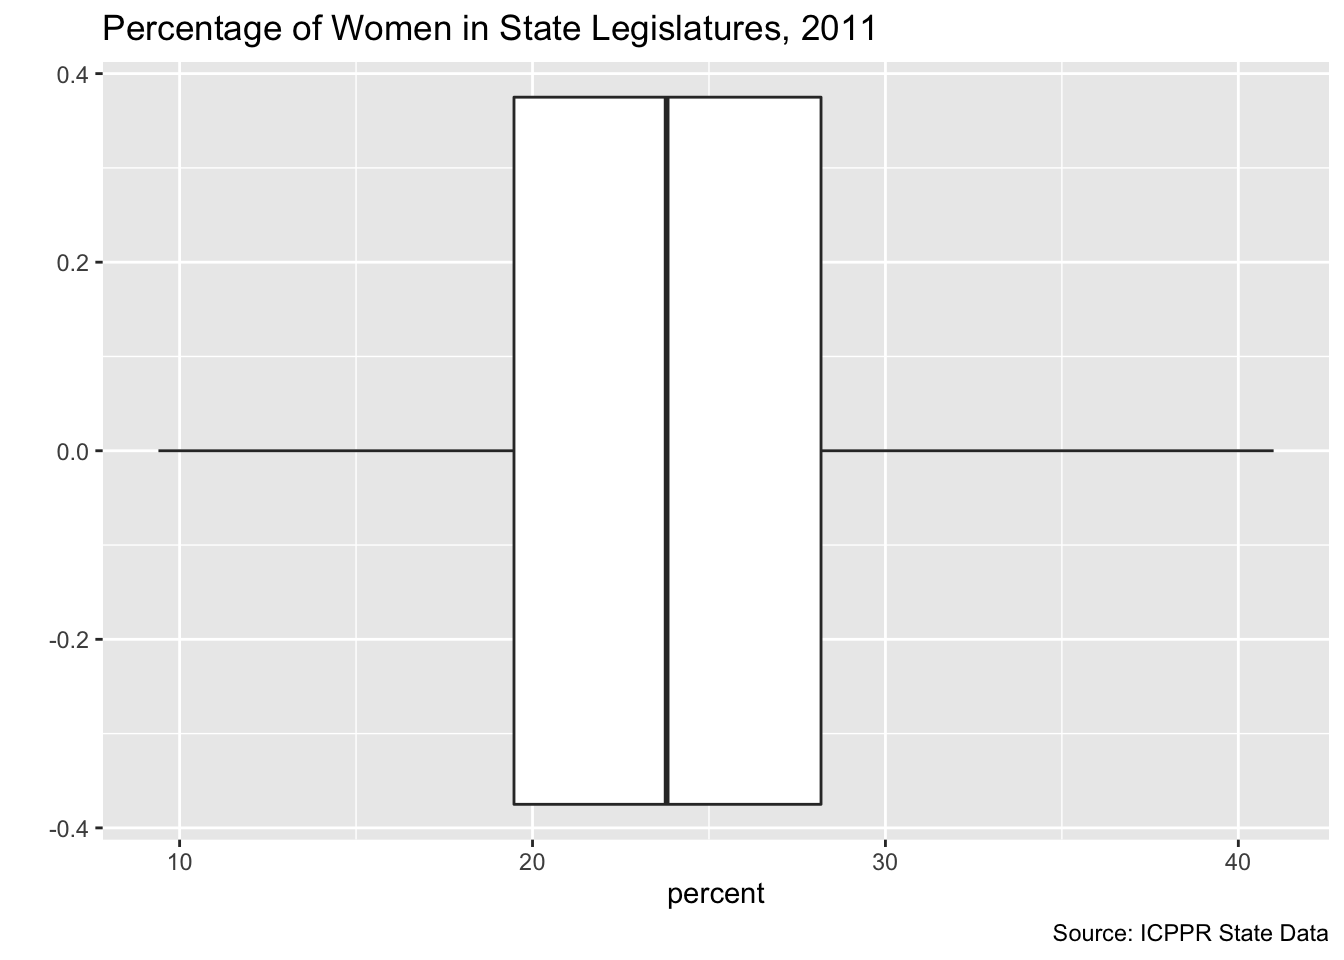
ggplot(data = my_gapminder_data_2003) + geom_boxplot(mapping = aes(x = mortalityRate)) +
  ggtitle("Mortality Rates of Countries, 2003") +
  labs(x = "", y = "", caption = "Source: Gapminder")